Arrow visualization
Create arrows for visualizing vectors, directions, and quantities in 3D space.
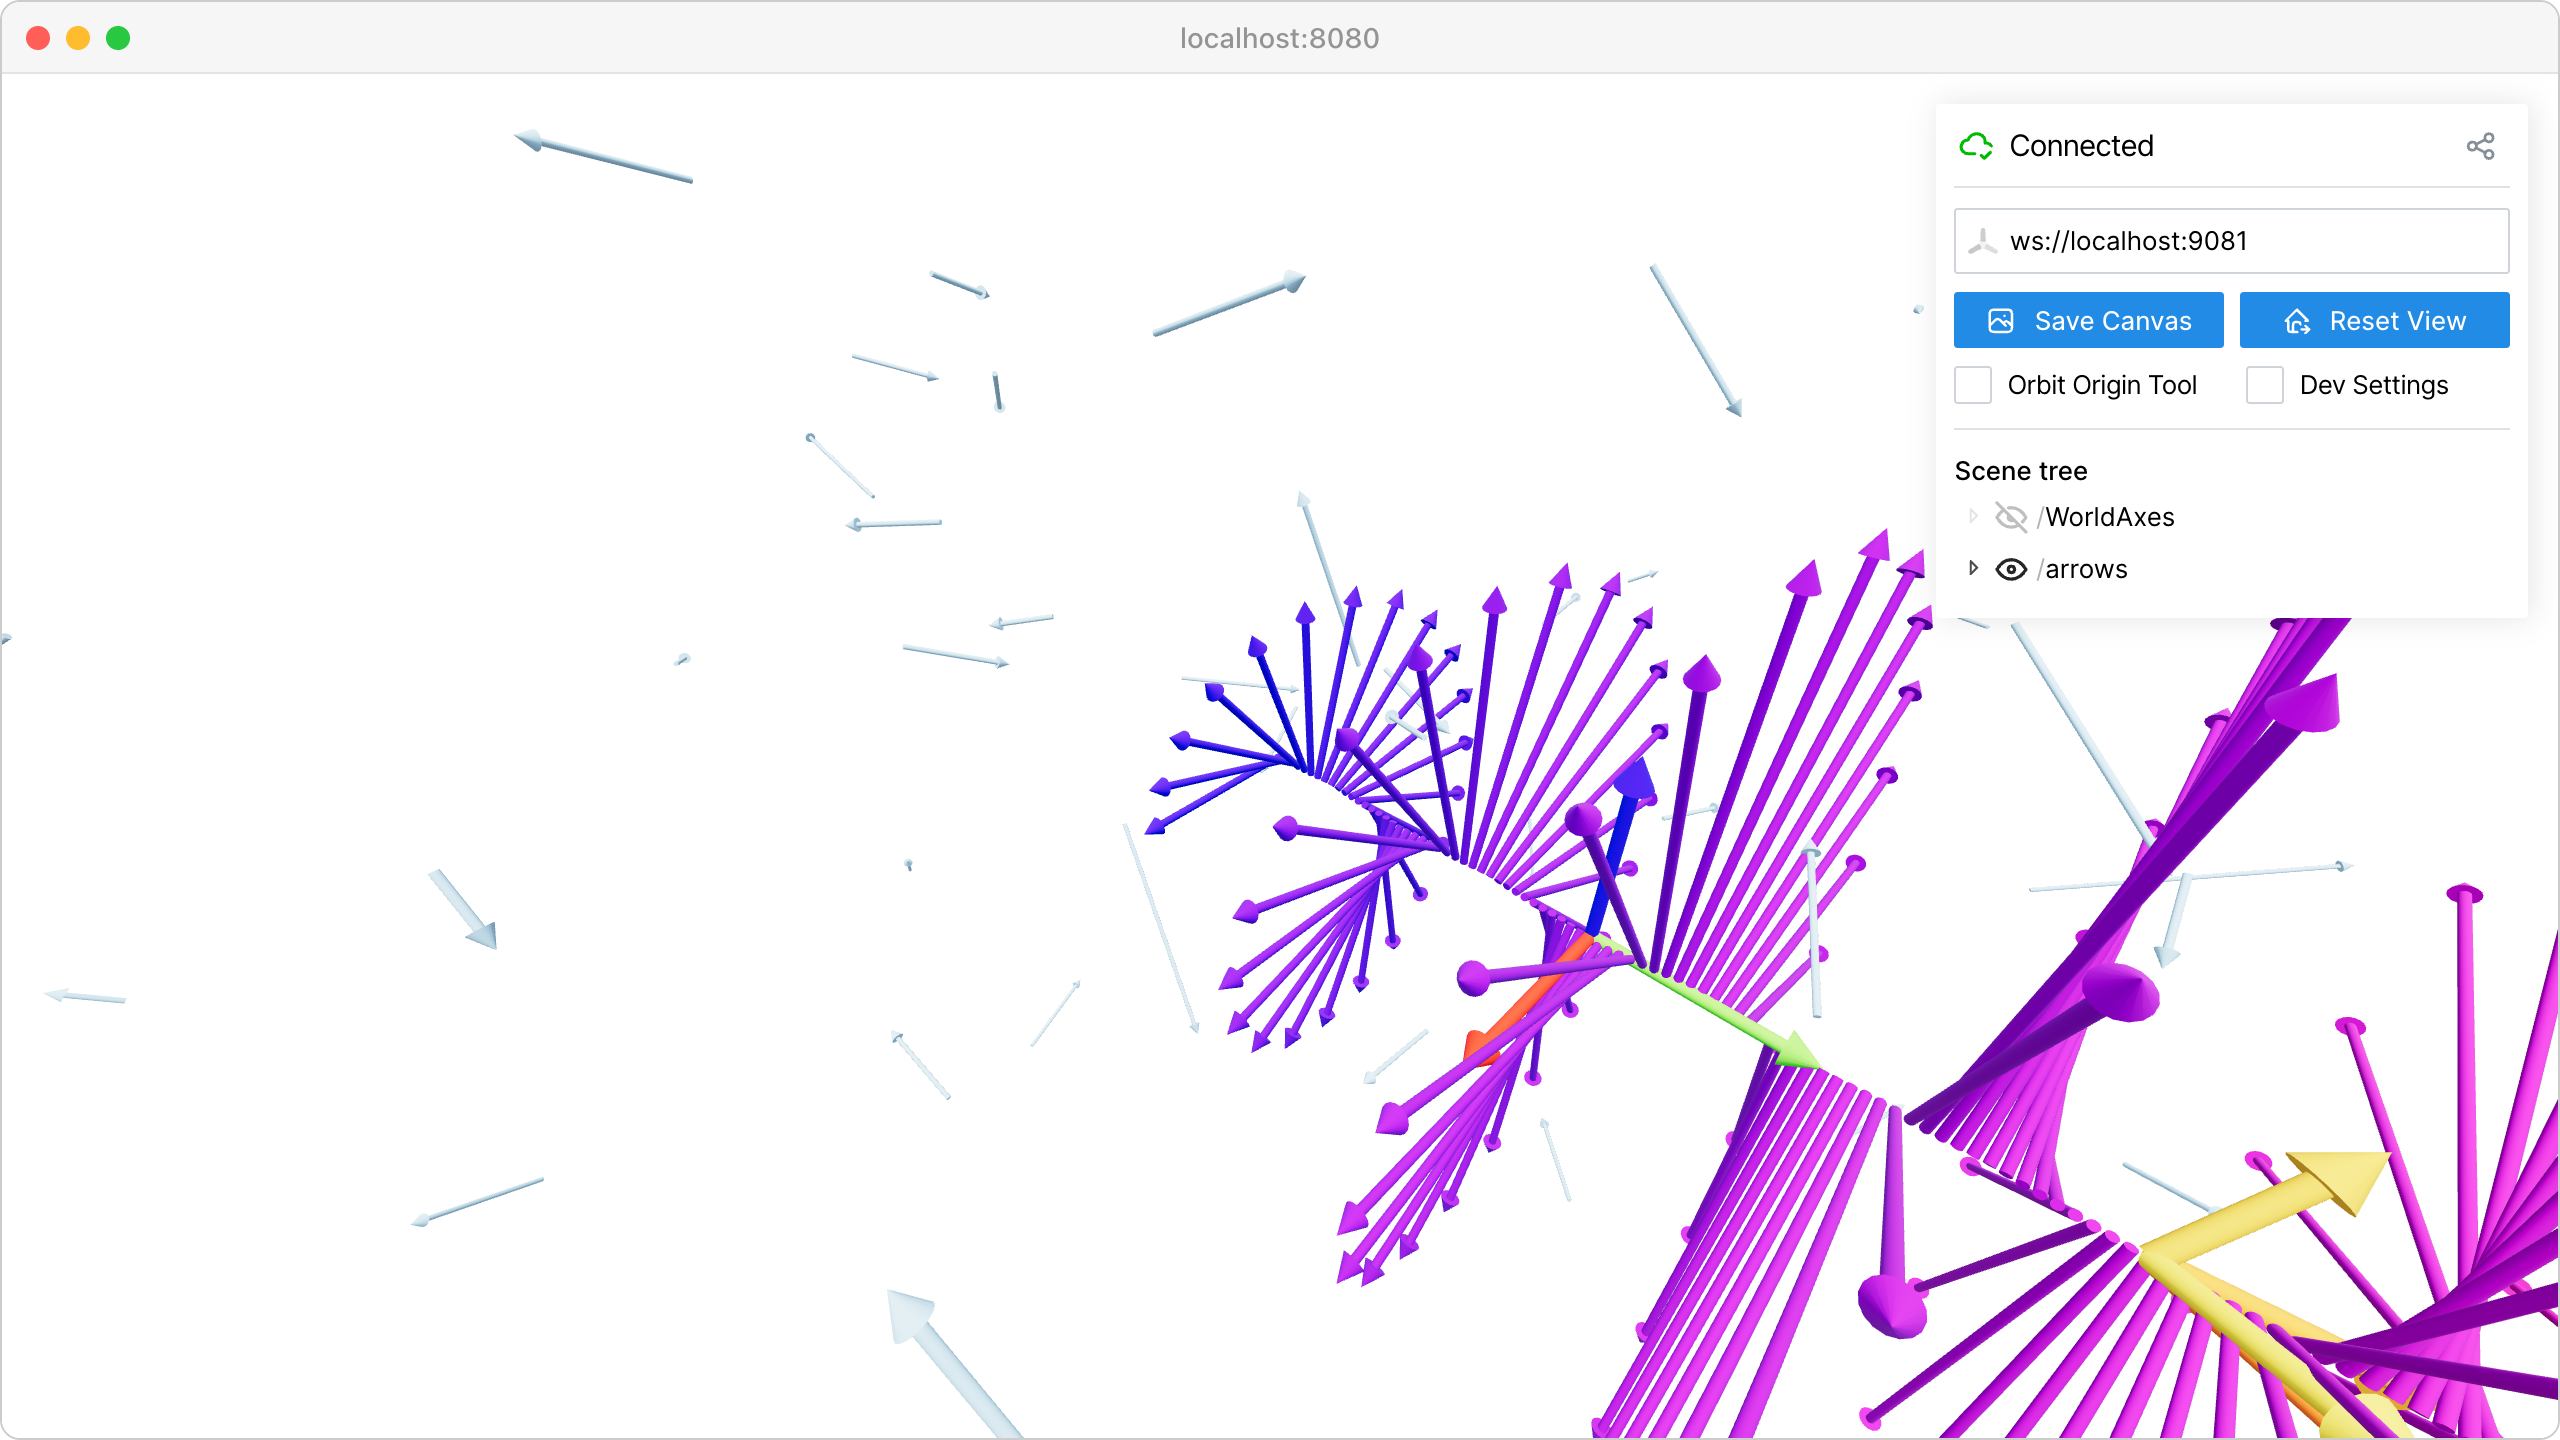
This example demonstrates viser’s arrow rendering capabilities, which are useful for visualizing directions, forces, velocities, and other vector quantities common in robotics and computer vision applications.
Use cases:
Perception rays in robotics and 3D sensing
Force vectors (contact forces, thruster forces)
Velocity vectors (commanded or actual velocities)
Axes of rotation and angular velocities
Coordinate frame directions
Arrows are batched into a single call for efficiency, similar to line segments. Each arrow is defined by a start point and end point, with configurable shaft radius, head radius, and head length.
Source: examples/01_scene/11_arrows.py
Code
  1import time
  2
  3import numpy as np
  4
  5import viser
  6
  7
  8def main() -> None:
  9    server = viser.ViserServer()
 10
 11    # Batched arrows.
 12    #
 13    # Create multiple arrows in a single call for efficiency.
 14    # points shape: (N, 2, 3) where points[i, 0] is the start and points[i, 1] is the end.
 15    N = 200
 16    points = np.zeros((N, 2, 3), dtype=np.float32)
 17    colors = np.zeros((N, 3), dtype=np.uint8)
 18
 19    for i in range(N):
 20        # Distribute arrows in a spiral pattern.
 21        theta = i * 0.3
 22        r = 1.0 + i * 0.02
 23        x = r * np.cos(theta)
 24        y = i * 0.05
 25        z = r * np.sin(theta)
 26
 27        points[i, 0] = [0, y, 0]  # start
 28        points[i, 1] = [x, y, z]  # end
 29
 30        # Color gradient from blue to red based on height.
 31        color_value = int(255 * (y / (N * 0.05)))
 32        colors[i] = [color_value, 0, 255 - color_value]
 33
 34    server.scene.add_arrows(
 35        "/arrows/spiral",
 36        points=points,
 37        colors=colors,
 38        shaft_radius=0.02,
 39        head_radius=0.05,
 40        head_length=0.1,
 41    )
 42
 43    # Coordinate frame arrows.
 44    #
 45    # Arrows are useful for visualizing coordinate frames and axes.
 46    origin = [0, 2, 0]
 47    frame_points = np.array(
 48        [
 49            [origin, [1, 2, 0]],  # X axis
 50            [origin, [0, 3, 0]],  # Y axis
 51            [origin, [0, 2, 1]],  # Z axis
 52        ],
 53        dtype=np.float32,
 54    )
 55    frame_colors = np.array(
 56        [
 57            [255, 0, 0],  # X: red
 58            [0, 255, 0],  # Y: green
 59            [0, 0, 255],  # Z: blue
 60        ],
 61        dtype=np.uint8,
 62    )
 63    server.scene.add_arrows(
 64        "/arrows/frame",
 65        points=frame_points,
 66        colors=frame_colors,
 67        shaft_radius=0.03,
 68        head_radius=0.08,
 69        head_length=0.15,
 70    )
 71
 72    # Force vectors example.
 73    #
 74    # Arrows can represent forces on an object. Here we show
 75    # contact forces on a simple object at position (0, 4, 0).
 76    contact_point = [0, 4, 0]
 77    force_points = np.array(
 78        [
 79            [contact_point, [0.5, 4.5, 0.3]],
 80            [contact_point, [-0.3, 4.8, -0.2]],
 81            [contact_point, [0.1, 5.2, -0.4]],
 82            [contact_point, [-0.4, 4.3, 0.5]],
 83        ],
 84        dtype=np.float32,
 85    )
 86    force_colors = np.array(
 87        [[255, 200, 0], [255, 100, 0], [255, 50, 0], [255, 150, 0]],
 88        dtype=np.uint8,
 89    )
 90    server.scene.add_arrows(
 91        "/arrows/forces",
 92        points=force_points,
 93        colors=force_colors,
 94        shaft_radius=0.04,
 95        head_radius=0.1,
 96        head_length=0.2,
 97    )
 98
 99    # Uniform color arrows.
100    #
101    # For simple visualization, a single color can be applied to all arrows.
102    N_velocities = 50
103    vel_starts = np.random.normal(size=(N_velocities, 3)).astype(np.float32) * 3
104    vel_ends = (
105        vel_starts + np.random.normal(size=(N_velocities, 3)).astype(np.float32) * 0.5
106    )
107    velocity_points = np.stack([vel_starts, vel_ends], axis=1)
108
109    server.scene.add_arrows(
110        "/arrows/velocities",
111        points=velocity_points,
112        colors=(100, 200, 255),  # Uniform light blue
113        shaft_radius=0.015,
114        head_radius=0.04,
115        head_length=0.08,
116    )
117
118    while True:
119        time.sleep(10.0)
120
121
122if __name__ == "__main__":
123    main()